The New Hampshire Alliance for Healthy Aging identified six domains as the focus of our collective impact initiative to promote a strong, stable infrastructure for healthy aging. These domains include Living Arrangements, Family Caregivers, Social and Civic Engagement, Physical and Mental Well-being, Advocacy, and Fundamental Needs. Building on the momentum of the strategic priority workgroups, we established a measurement framework to monitor performance and track progress to achieve our shared vision.
In parallel with NHAHA’s measurement efforts, a Field Assessment Tool (FASST) is used to assess the capacity of the healthy aging field in New Hampshire. Developed by the Behavioral Health Improvement Institute, the healthy aging field can be thought of as individuals, groups, and organizations working to improve aging issues. FASST uses seven domains to assess the healthy aging field including: Shared Purpose, Leadership and Community Support, Shared Knowledge, Quality Programs and Services, Adequate Funding and Support for Policy, Adaptive Capacity, and Equity. To gather this information, FASST interviewed key informants on each of these domains. FASST has been used three times (i.e., 2016, 2019, 2023) to track progress and assess the healthy aging field. Results have shown that over time, the field of healthy aging has made improvements. For example, there has been a deepening of collaboration across aging initiatives, growing engagement with diversity, equity, and inclusion, and rapid adoption of remote technologies. For more information and data on FASST, click here.
To best assess how the aging field and communities are changing over time, our measurement framework focuses on both process and outcome strategies.
Process Strategy: Process indicators are used to identify and track short-term goals for each of the strategic priority workgroups and committees using goals that are Specific, Measurable, Attainable, Relevant, and Timely (SMART).
Outcome Strategy: The six domain areas of NHAHA’s shared vision provide the groundwork for measuring our long-term success in relation to creating and maintaining age friendly communities. Therefore, our outcome strategy assesses, monitors, and tracks important aspects of communities and systems that support older adults and their families. This includes providing data that is consistent and reliable, and providing a national comparator when available. Measuring social determinants of health from a person-centered perspective, a key aspect of the NHAHA shared vision, is gaining traction as the awareness of social aspects of health increases. Currently, there are limited data sources that take this approach. NHAHA will continue to address the gaps in our outcome measurement strategy as sources become available.
Click on the domain and general measures in the wheel to review the NHAHA outcome measures.
Source: U.S. Census Bureau, American Community Survey (2017)
Source: U.S. Census Bureau, American Community Survey (2017)
Source: New Hampshire Healthy Aging Data Report (2019) and American Community Survey (2018)
Source: Administration for Community Living, Aging Integrated Database (2015)
Source: New Hampshire Healthy Aging Data Report (2019) and American Community Survey (2018)
Source: U.S. Census Bureau, American Community Survey (2016)
Source: U.S. Census Bureau, Gallop, Williams Institute UCLA School of Law (2016)
Source: New Hampshire Healthy Aging Data Report (2019) and U.S. Census Bureau, American Community Survey (2016)
Source: U.S. Census Bureau, American Community Survey (2017)
Source: Centers for Disease Control and Prevention, Behavioral Risk Factor Surveillance System (2017)
Source: New Hampshire Healthy Aging Data Report (2019) and United States Health and Human Services, Centers for Medicare and Medicaid Services (2017)
Source: New Hampshire Healthy Aging Data Report (2019)
No data available at this time.
No data available at this time.
Source: National Member Opinion Survey, NH Findings, AARP (2012)
No data available at this time.
No data available at this time.
No data available at this time.
Feeding America, The State of Senior Hunger in America Report Series
Administration on Community Living, AGID Database
Meals on Wheels: NH Fact Sheet (2021)
Administration on Community Living, AGID Databse (2021)
U.S. Census (2023)
*Note: This indicator does not speak to food preferences, quality of food provided, or the rate of utilization. UNH Cooperative Extension (2025)
NEW HAMPSHIRE - 2025
The U.S. Department of Agriculture (USDA) defines a food desert as a community where there is at least a 20% poverty rate and 33% of the residents of the community live more than 1 mile from the nearest grocery store in urban areas or 10 miles from the nearest grocery store in rural areas.
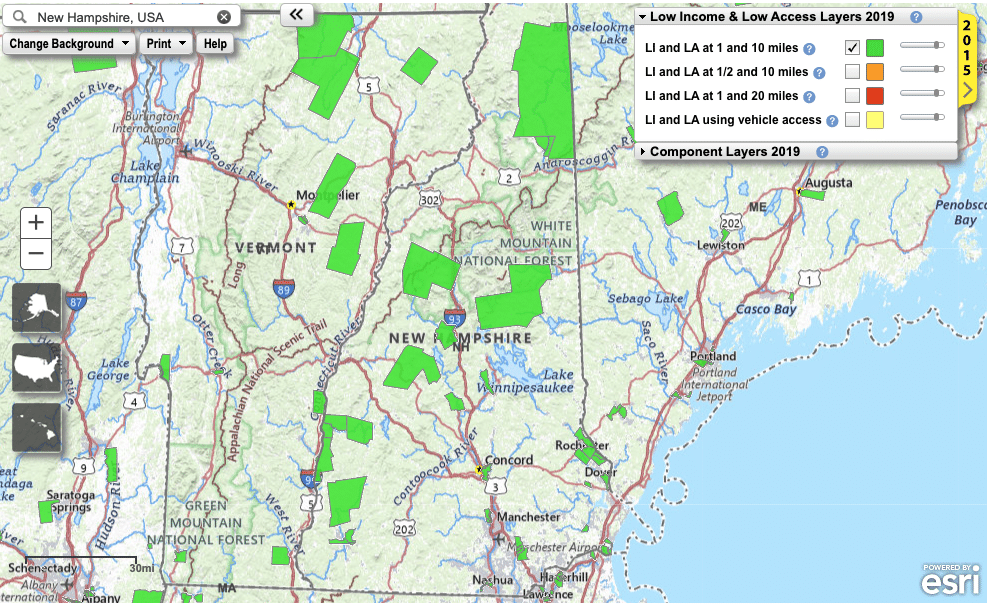
U. S. Department of Agriculture (2025) https://www.ers.usda.gov/data-products/food-access-research-atlas/go-to-the-atlas
Healthy Aging Data Report – 2017
Source: Centers for Disease Control and Prevention, Behavioral Risk Factor Surveillance System (2017, 2023)
Source: Centers for Disease Control and Prevention, Injury Prevention and Control (2009)
FEMA (2025)
No data available at this time.
NH Department of Motor Safety (2017 – 2021)
NH Department of Motor Safety (2021)
Federal Bureau of Investigation (2023)
Federal Bureau of Investigation (2023)
AARP
State Plan on Aging Survey (2023)
Federal Bureau of Investigation (2022)
Systems Assesment and Gaps Analysis
NH Drug Monitoring Initiative (2024)
Healthy Aging Data Report (2025)
America’s Health Rankings (2019)
Source: U.S. Census Bureau, American Community Survey
Source: National Member Opinion Survey, NH Findings, AARP (2012)
Source: NH Library Trustees
Source: NH Healthy Aging Data Report
Source: Aging and Disability Resource Network, DHHS
Source: United Way
No data available at this time.
No data available at this time.
Regional Mobility Management Network (2025)
Regional Mobility Management Network (2025)
Regional Mobility Management Network (2025)
Volunteer Driver Programs (VDPs) are complex and vary by provider and region. Service types, eligibility, trip purpose, service area, scheduling requirements, and rider criteria differ across programs. As a result, access remains difficult to measure consistently, and residents can face confusion and barriers when trying to understand what is available and how to use it.
NHAHA Volunteer Driver Initiative (2023)
NHAHA Volunteer Driver Initiative (2023)
NHAHA Volunteer Driver Initiative (2023)
No data available at this time.
No data available at this time.
Source: NH Department of Health and Human Services, Bureau of Elderly and Adults Services (2018)
*NH DHHS Division of Long-Term Supports and Services, Bureau of Elderly and Adult Services produces a “Guide to Services” document. In addition, NH 211 and NHCarePath have searchable databases for serves.
No data available at this time.
Source: Provided by multiple organizations
No data available at this time.
No data available at this time.
Source: NH Department of Health and Human Services, ServiceLink Aging and Disability Resource Center Searchable Database
No data available at this time.
Source: Centers for Disease Control and Prevention, Behavioral Risk Factor Surveillance System (2017)
Source: Centers for Disease Control and Prevention, Behavioral Risk Factor Surveillance System (2016)
Source: Kaiser Family Foundation, Centers for Medicare and Medicaid, (2017)
Source: American Geriatrics Society (2017)
No data available at this time.
No data available at this time.
No data available at this time.
No data available at this time.
No data available at this time.
Source: NH Department of Health and Human Services, Bureau of Elderly and Adult Services (2018)
No data available at this time.
No data available at this time.
These resources are for individuals interested in exploring and understanding their community’s older adult health and wellness status, or perhaps launching an age-friendly initiative or program in their community.
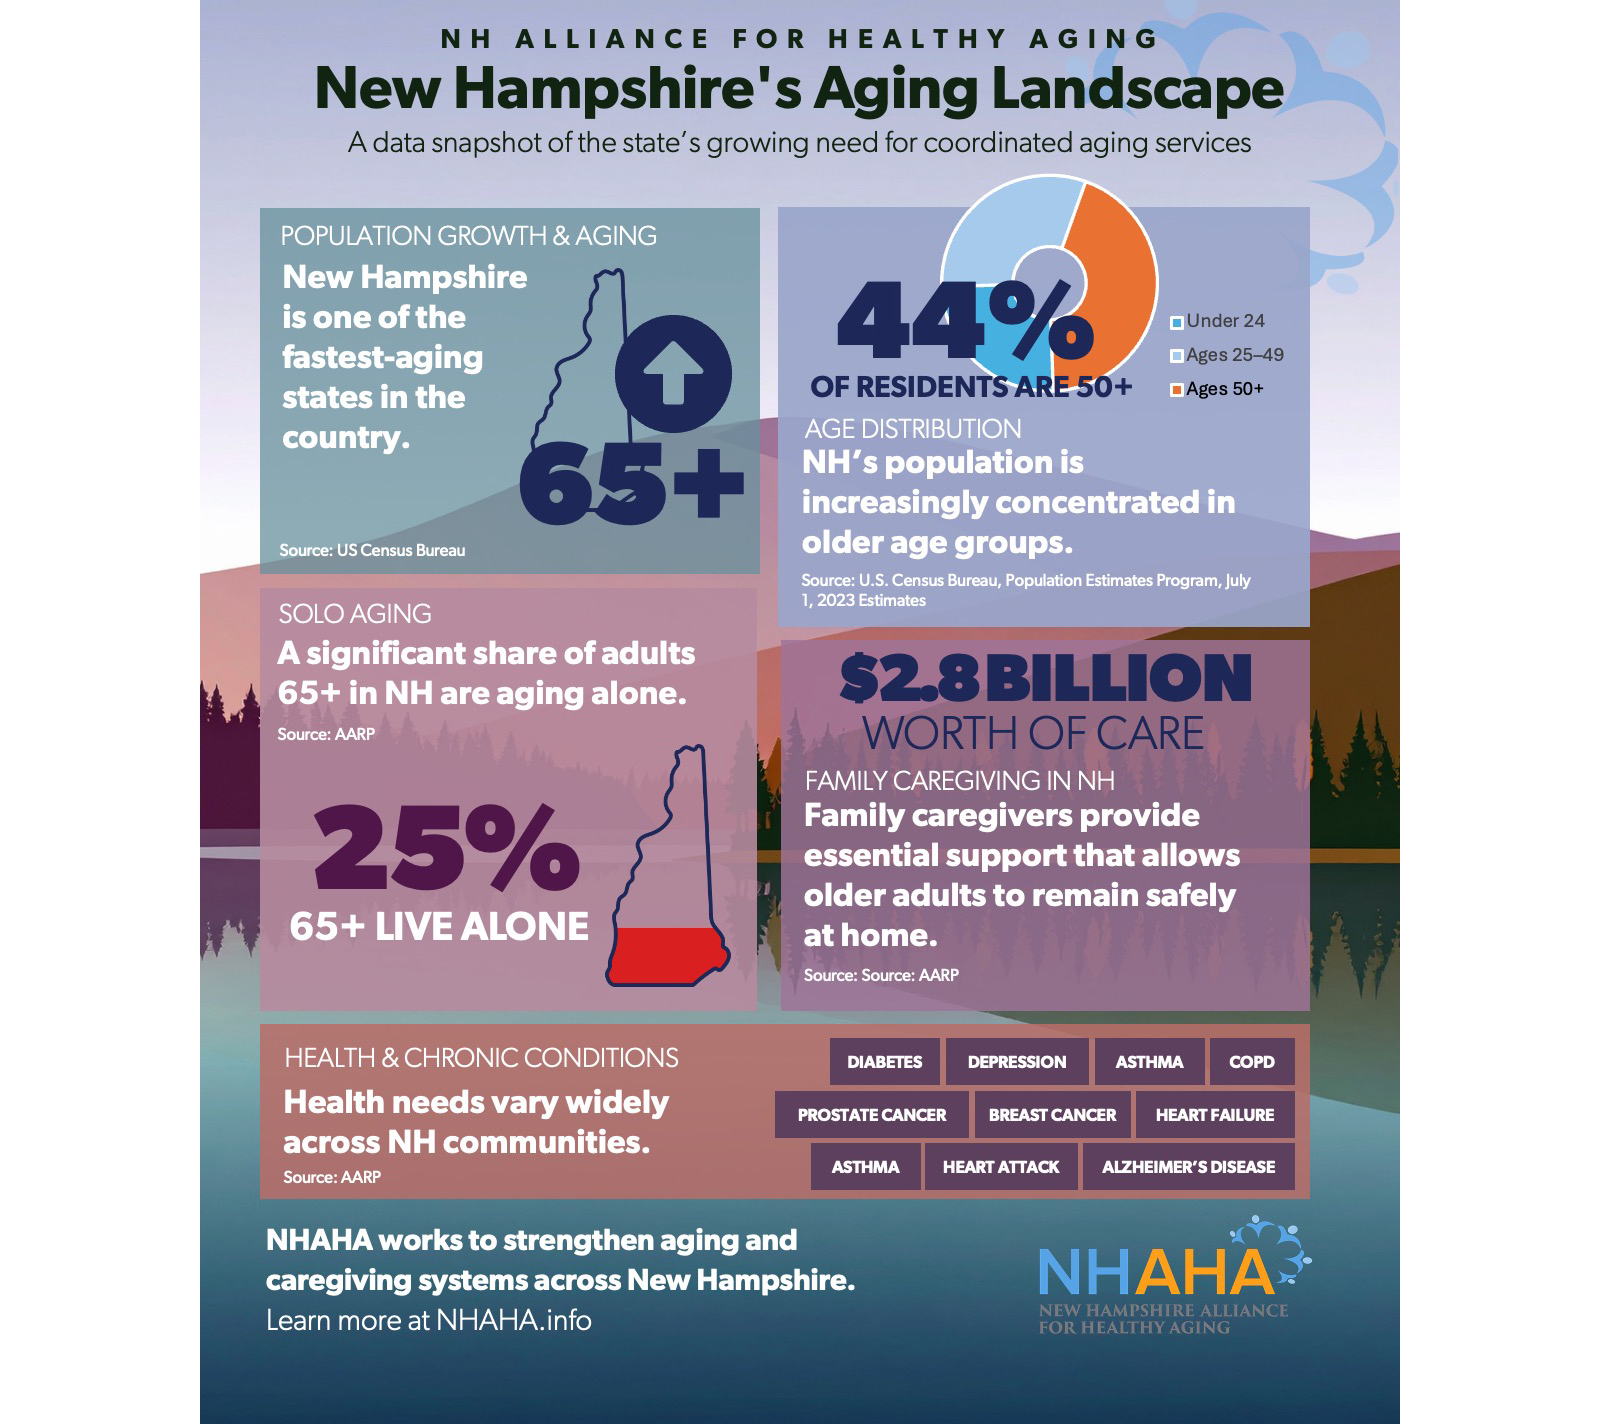
The New Hampshire Healthy Aging Data Report is designed to help communities understand more about the health of older people throughout the state. With research designed and led by the University of Massachusetts Boston, the report includes 244 Community Profiles —one for every city and town in New Hampshire and includes 166 health indicators and state averages. The original report was launched in 2019 and updated in 2025.
Includes data sets, tools, and visualizations.
Disability statistics published by many federal agencies into one place.
A measure of the income that older adults need to meet their basic needs and age in place with dignity. The Elder Index is specific to household size, location, housing tenure, and health status.
Offers a wide range of measures, reports, and related resources for Medicaid and other DHHS program data.
Provides information about health data sources and reports.
Provides interactive dashboards to measure health, health risks, and health outcomes, illustrating the well-being of NH and our communities.
A report developed every 5-7 years and describes the status of a variety of issues related to the health of the people in New Hampshire. The SHA provides the foundation for the State Health Improvement Plan (SHIP) which helps decision makers in choosing where to put resources to address NH residents’ greatest health needs.
Offers tools and resources to build sustainable age-friendly initiatives, including assessment and measurement tools.
A cooperative about improving what is measured in communities.
March 31, 2026
Welcome to this week’s “AHA Moments,” a weekly news flash regarding key events, happenings, articles, and other relevant information for our stakeholders. New…
LEARN MOREMarch 26, 2026
Welcome to this week’s “AHA Moments,” a weekly news flash regarding key events, happenings, articles, and other relevant information for our stakeholders. …
LEARN MORE
Social and Civic Engagement Options are Plentiful
NEW HAMPSHIRE
32.3% of people aged 65 and older report volunteering in the past 12 months
UNITED STATES
26% of people aged 65 and older report volunteering in the past 12 months
Source: Corporation for National and Community Service (2017)
NEW HAMPSHIRE
6.5% of people aged 65 and older are experiencing frequent mental distress
UNITED STATES
7.3% of people aged 65 and older are experiencing frequent mental distress
Source: Centers for Disease Control and Prevention, Behavioral Risk Factor Surveillance System (2016)
There are no existing measures at this time.
There are no existing measures at this time.
Related Resources